Automatically categorizes each reading using standard ranges and tracks running averages, so trend direction is clear instead of a stack of loose paper numbers.
Automatic trend charts mean you walk into your next appointment with a doctor-ready history, not a stack of scribbled numbers.
Backed by a 30-day money-back guarantee. If it is not useful, we will refund it, no questions asked.
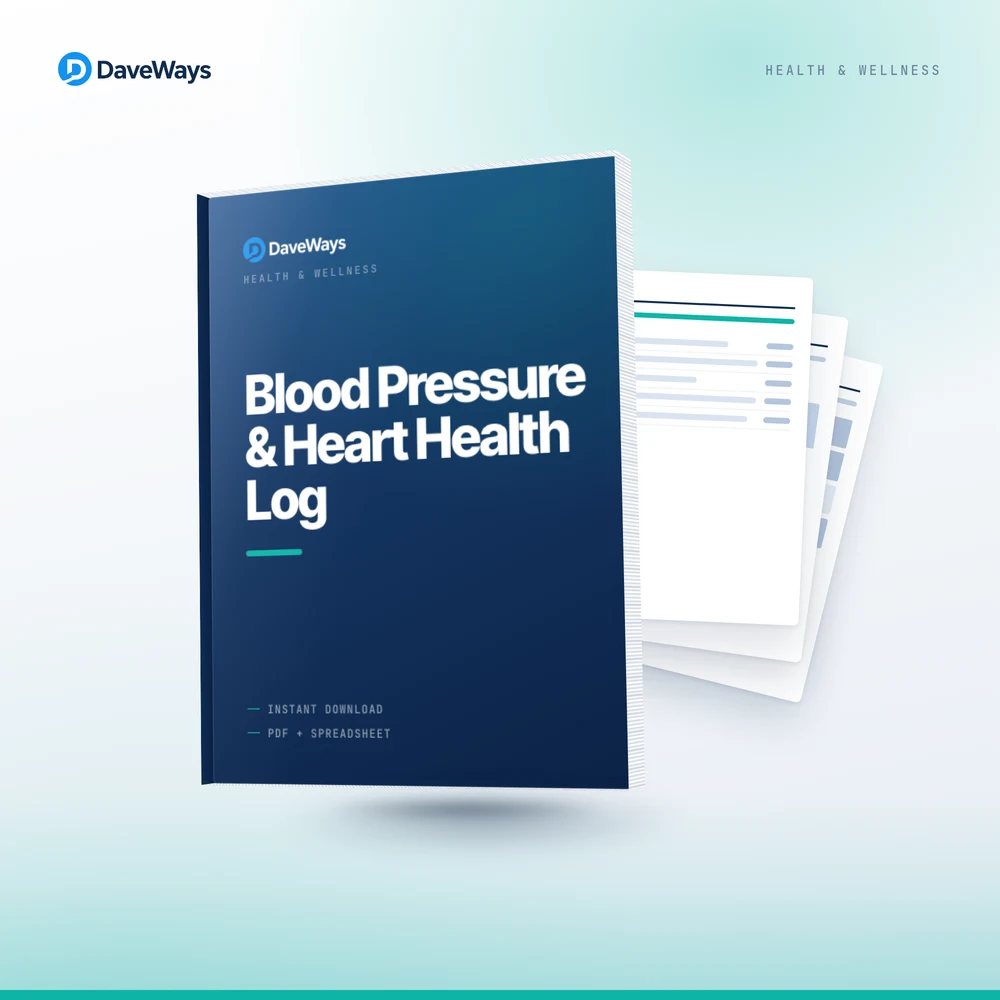
Home blood pressure logs on paper are messy and don't show trend direction the way a doctor actually needs to see it. This log takes the same systolic, diastolic, and pulse readings you'd write on paper and turns them into a running average view with automatic categorization.
Take your blood pressure at the same time of day, using the same arm and position, for consistent readings, and log systolic, diastolic, and pulse every time; the sheet categorizes each reading automatically using standard ranges. Watch the running average columns rather than any single reading, since blood pressure naturally varies reading to reading, and note anything unusual (stress, poor sleep, medication changes) that might explain an outlier. Bring the printed log with trend averages to your next doctor visit instead of a stack of loose paper readings.
We built this after hearing how often doctors get handed a stack of inconsistent paper readings with no clear trend. A running average with automatic categorization turns the same raw numbers into something a doctor can actually read at a glance.
— DaveWays
Systolic, diastolic, and pulse get categorized using standard ranges the moment you log them.
Trend averages smooth out normal reading-to-reading variation so you see the real direction.
Bring one printed log with trend averages instead of a stack of individual readings.
Is this a substitute for medical advice or diagnosis?
No, it's a personal tracking log only, not medical advice; discuss all readings and trends with your doctor.
What standard ranges does the categorization use?
It uses widely published home blood pressure categories (normal, elevated, stage 1, stage 2); confirm your target range with your doctor since individual targets can vary.
How often should I take readings?
Follow your doctor's recommended frequency; many people log once or twice daily at consistent times for the clearest trend.
Blood Pressure & Heart Health Log (Free Preview) — download a condensed version free, no purchase required, to see if it's a fit before you buy.
Blood Pressure & Heart Health Log is $12.99 USD, one-time payment, instant delivery, no subscription. Covered by our 30-day money-back guarantee. See our refund policy and terms.